3h
Human ITGa1(Integrin Alpha 1) ELISA Kit
Human ITGa1(Integrin Alpha 1) ELISA Kit
Assay length
Sensitivity
29pg/mL
Assay Type
Sandwich
Standard
5000pg/mL
Detection range
78.12-5000pg/mL
Research Area
CD & Adhesion molecule;
Test
ELISA Enzyme-linked immunosorbent assays Code 90320007 SNOMED
Alternative Names
CD49-A; CD49a; ITG-A1; VLA1; CD49 antigen-like family member A; Laminin and collagen receptor
Description
The ITGa1(Integrin Alpha 1) ELISA Kit is a α- or alpha protein sometimes glycoprotein present in blood.
Properties
E05 478 566 350 170 or Enzyme-Linked Immunosorbent Assays,E05 478 566 350 170 or Enzyme-Linked Immunosorbent Assays,Human proteins, cDNA and human recombinants are used in human reactive ELISA kits and to produce anti-human mono and polyclonal antibodies. Modern humans (Homo sapiens, primarily ssp. Homo sapiens sapiens). Depending on the epitopes used human ELISA kits can be cross reactive to many other species. Mainly analyzed are human serum, plasma, urine, saliva, human cell culture supernatants and biological samples.
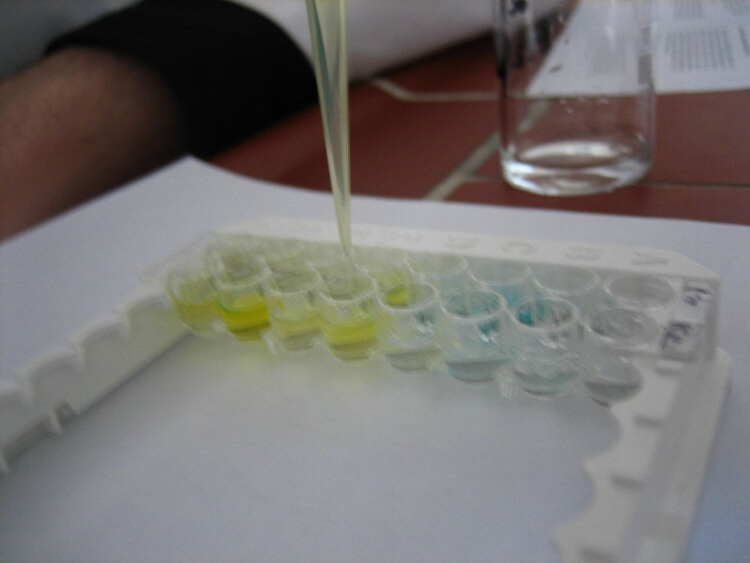
Test principle
The test principle applied in this kit is Sandwich enzyme immunoassay. The microtiter plate provided in this kit has been pre-coated with an antibody specific to Integrin Alpha 1 (ITGα1). Standards or samples are then added to the appropriate microtiter plate wells with a biotin-conjugated antibody specific to Integrin Alpha 1 (ITGα1). Next, Avidin conjugated to Horseradish Peroxidase (HRP) is added to each microplate well and incubated. After TMB substrate solution is added, only those wells that contain Integrin Alpha 1 (ITGα1), biotin-conjugated antibody and enzyme-conjugated Avidin will exhibit a change in color. The enzyme-substrate reaction is terminated by the addition of sulphuric acid solution and the color change is measured spectrophotometrically at a wavelength of 450nm ± 10nm. The concentration of Integrin Alpha 1 (ITGα1) in the samples is then determined by comparing the O.D. of the samples to the standard curve.